Progress and Results from the 2000-2002 surveying seasons
 |
The following primary datasets have been acquired over the course of the first years' surveying;
|
| Zone
3 The deep water Zone 3 Survey was carried out between 2000 and 2002 by two vessels belonging to Global Ocean Technologies (GOTECH), an Irish marine survey company which was successful in the international tender process. Zone 3 surveying was 24hrs a day and stops were very limited. However, random, rather than regular grid spaced stops, were made to do full ocean depth Sound Velocity Profiles (SVP's). Survey speeds were relatively fast, with average speeds of 8 knots. The Bligh and the Siren were the two vessels used. |
|
 |
The
map on left shows the Zone 3 area's full coverage upon its completion
in June 2002. The 2000 surveying season was quite short stretching
only from July until November. Despite this late start to the acquisition
season and some adverse weather conditions, coverage and data quality
was very good. 2001 was a much lengthier surveying season, beginning
in March and running right through to November. The 2002 season
opened on March 28th when the Bligh departed from Waterford Harbour
to complete Zone 3. This she did in 3G and she made her final return
port call at Waterford on June 6th. On October 2 the final
report for Zone 3 was handed over to G.S.I.
|
| The GSI has also undertaken other data acquisition programmes within the Zone 3 area. For example, by July 2002 a refraction seismic survey and a seabed sediment sampling programme had been completed and the data collected from both programmes have now been analysed and evaluated. |  |
|
Zone 2
|
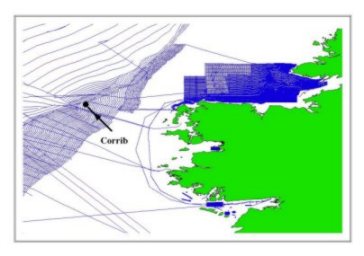 |
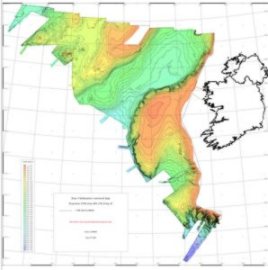
The figure above right shows the coverage of Zone 2 that was completed during the short August-October period of the 2002 surveying season and the limited Zone 1 coverage. The main concentration was on Donegal Bay but some coverage was also achieved in Galway Bay, Clew Bay and along all of the transit lines in between. In April 2003 the newly commissioned Celtic Explorer takes over the Donegal Bay surveying from her sister ship.
Zone 1
As noted above some surveying has also taken place in the Zone 1 area. In 2002 a pilot LADS Survey (Laser Airborne Depth Sounder Survey) took place off the Mayo coast in Clew Bay to see how airborne (Lidar) surveys could be applied in Irish waters.
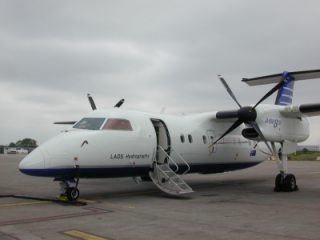 |
Results from this Survey which were initially processed in Australia by the contractors, the Tenix LADS Corporation and then QC-checked in GSI offices were found to be excellent. Further work will be carried out on them and they will be formally handed over to the Westport Harbour Authority and the British Hydrographic Office so that a more than 100 year old navigation chart for the area can be updated. |
Sample results
 |
The SVP chart here left is taken from the Edoras Bank area of 3A. The SVP readings are taken on a regular basis and include temperature, salinity and depth data. In addition, a programme of disposable Sippi-Can sound velocity measurements was initiated by Glenn Nolan, Marine Institute, Galway in 2001 over the Rockall Trough area. To date 30 have been taken across the Rockall Trough. |
|
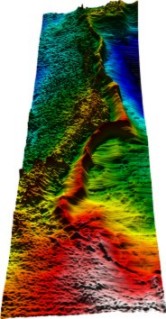
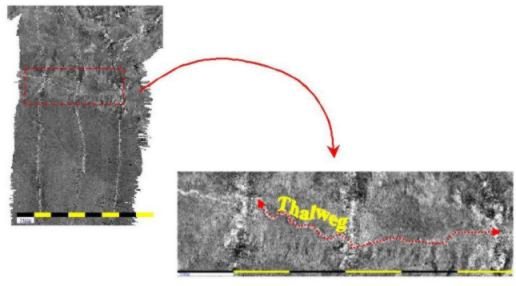
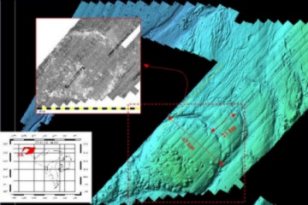
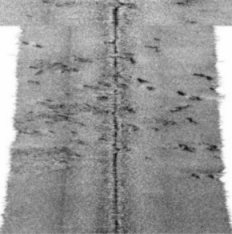
The backscatter image below taken at a water depth of in excess of 3,000m represents a typical geomorphologic feature - an active channel deposition complex. The width of the thalweg indicated shows the excellent resolution achieved.
|
|
In addition to the geophysical and hydrographic datasets a number of ancillary scientific datasets have been acquired;
For further information see section on Ancillary Projects and for specific information related to a CMRC study click here. |
From the maps produced to date it is already clear that lots of exciting and interesting results have been produced by the National Seabed Survey.
- There have been indications of the existence of hydrocarbons in the form of gas escape features and mounds (see images below).
- Interpretation of the backscatter maps clearly identifies both active and inactive deep-water channel complexes.
- Areas of catastrophic slope failure have also been identified.
- Substantial numbers of carbonate mounds and bioherms (reefs) of Lophelia pertusa (a deep sea cold water coral), not previously identified, have been observed in the multibeam and sub bottom profile records.
- Many other low relief features such as sedimentary bedforms have also been successfully resolved.
- There is clear potential for studying ocean circulation patterns.
 |
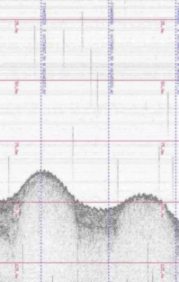 |
The images above suggest the existence of gas associated with carbonate mounds. The deep water coral, Lophelia is also associated with these mounds.
 |
The image left is taken from the Edoras Bank-Maury Channel areas of Zone 3A. It gives a clear representation of mound features, rock outcrop, channels and mobile sediments bedforms (this is raw unfiltered data). |
| Opposite is a sun illuminated image of a partial area of 3E covered again showing channel complexes and ships tracks. The image was generated on-line. | 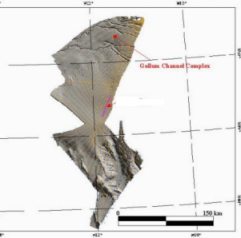 |
|
The backscatter image here shows a carbonate mound field north-west of the Rockall Bank. The mounds are 300-500m in diameter. The image was produced on-line in real time and is unfiltered. |
 |
Now with
four survey seasons completed it is clear that many more interesting features
and possibilities continue to unfold
.